
In business what is measured gets done!
We subscribe to the business adage that what is measured gets done! For this reason key performance indexes are absolutely essential to the success of any customer service environment. How many contacts did we manage today? How long did a contact have to wait on hold before we were able to engage them? How much time does an average customer engagement actually take? What is the rate of abandonment and how long did a caller tolerate waiting before they gave up and hung up the phone? Sometimes we have to refer back in time and search “historical” records to locate a specific caller and verify the fact that they actually called! Other times, we have to be aware of “real time” data and be alert to what is happening right now! How many callers are waiting to engage us? So where do you obtain this type of information no how easy is it to obtain?
ShoreTel Call Accounting
In a ShoreTel solution there are at least three separate databases that keep this kind of information. The ShoreTel iPBX can generate historical reports out of the internal Call Detail Records log using the integrated report generator that you access through the ShorewareDirector administrative interface. A great solution if you want to generate total trunk activity reports showing the aggregate number of inbound and outbound calls. It has detail reports that can even list every phone call made by every extension user in the system. Ask it a simple question like how many phone calls did we receive this month from 202-555-1234 and you will quickly learn the limitations of this system solution.
The ShoreTel ECC has an internal historical data repository and a primitive report generator that has mystical templates that you can modify to create performance reports. You can not however, directly access the data in that database! The internal historical report generator has some serious limitations however. For example, do you want to generate a Group Activity report, showing all the desired metrics for all Groups in your deployment? You would have do to this one Group at a time using the ShoreTel provide tools.
The ShoreTel C2G is a veritable cesspool of disjointed data elements or “events” like, extension 123 went off hook; IRN 155 received an incoming request for service and Agent 789 logged in. Not very useful unless you are an accomplished SQL programming genius and want to spend your career figuring out the ShoreTel data dictionary while writing custom reports that assemble all of these events into meaningful record.
Though ShoreTel has some “standard reports” the fact is, you will want to generate custom reports unique to your environment. No matter how many templates are provided, we have yet to encounter a call center that did not have unique one off requirement when it came to reporting performance metrics. Where is the data? Is it in the PBX? or the call center? How do you track a call that came into the PBX, connected with the call center and transferred to an offsite backup answering service? Do I have to retain a SQL programmer to figure this all out? (Fortunately brightmetrics has already done that for you).
BrightMetric Illumination!
brightmetrics has created a powerful, yet very simple to navigate report generator available as a hosted solution. Connecting with the various databases internal to your ShoreTel deployment, brightmetrics can sort and integrate data from the PBX side, the Contact Center side and that cesspool of events that contain information from both sides of the data equation. Are you running ShoreTel Workgroups? BrightMetric puts wheels on the information that would otherwise require professional application software add-ons from ShoreTel.
The brightmetrics user interface is easy to understand and navigate. The portal has video based help files and report templates for almost every type of data assembly. You can generate reports on demand. Save reports and schedule reports for future delivery. The administrator can setup user accounts that provide access to specific report profiles and easy to understand “dashboards”.
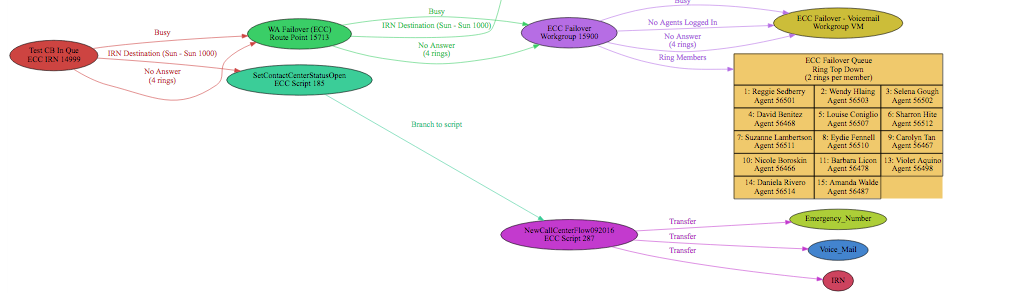
Call Flow Diagrams can save an Admin’s life!
One of the most useful none numerical feature of brightmetrics is the ability to diagram your call flow. Have you every wondered about your automated attendant options, Hunt Groups, Route Points and IRN’s? Where do all the options lead? If you press 1 for customer service, where does the caller go and what are the possible outcomes for that caller? Do you have a complex SQL data dip over an OBDC connector from you ShoreTel ECC? Want to see where all the routing options might point to? This feature will map and diagram call flow from an Automated Attendant, IRN, Workgroup, ECC service and even an ECC Script!
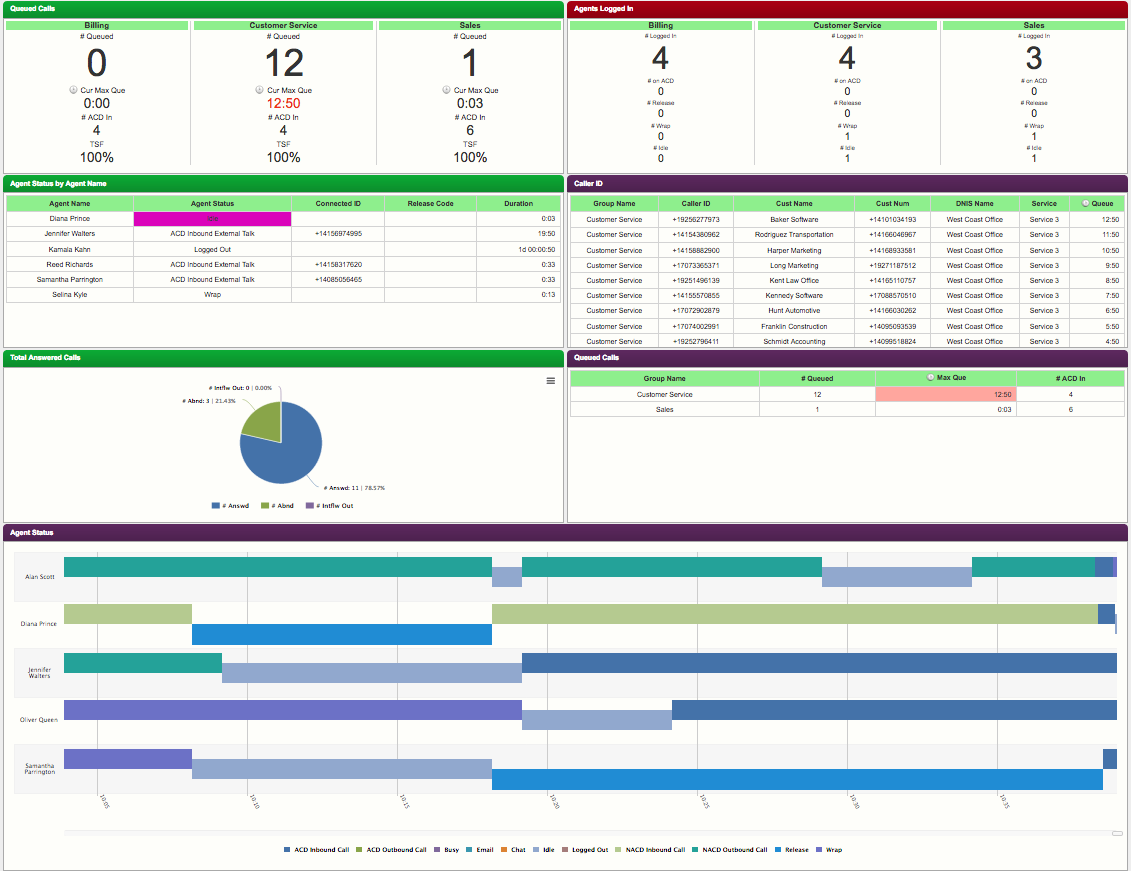
How about Real-time Reports?
Historical reporting is extraordinarily important to both customer service and employee productivity. Real-time information is also very necessary and important. brightmetrics has introduce a new element to the product mix and now offers Real-time displays suitable for framing! If you have ever tried to make a Wall Board out of ShoreTel supervisor desktop, you now how frustrating getting status information in front of the Call Center team can be! Using a real-time event feed, brightmetrics can display comprehensive status information formatted for legibility and clarity!
The brightmetrics team!
brightmetrics has been making incremental improvements in the product from day one and post all of there progress, both features and bugs! Today the are generally recognized as the only viable solution for ShoreTel call accounitng accuracy and flexibility. More importantly, the company behind the brightmetrics product family is an astonishing group of people. Usually, pre-sale is about as good as it gets in American business! Not the case with brightmetrics! The real story begins after you sign on with them. The folks in this company from Jim Lewis the founder and CEO through each and every person you meet on the team, will treat you with a level of commitment and customer focus, that in this day of “Internet shopping carts” is very rare. Ask a question, open a support ticket, make a suggestion even offer a criticism and these folks will overwhelm you with not only time but focused attention. We have worked with many clients who use the brightmetrics solution and we have always had the most positive and productive experience. Technology is great but its people who make the difference!